GASATaD: Graphical Application for Statistical Analysis of Tabulated Data
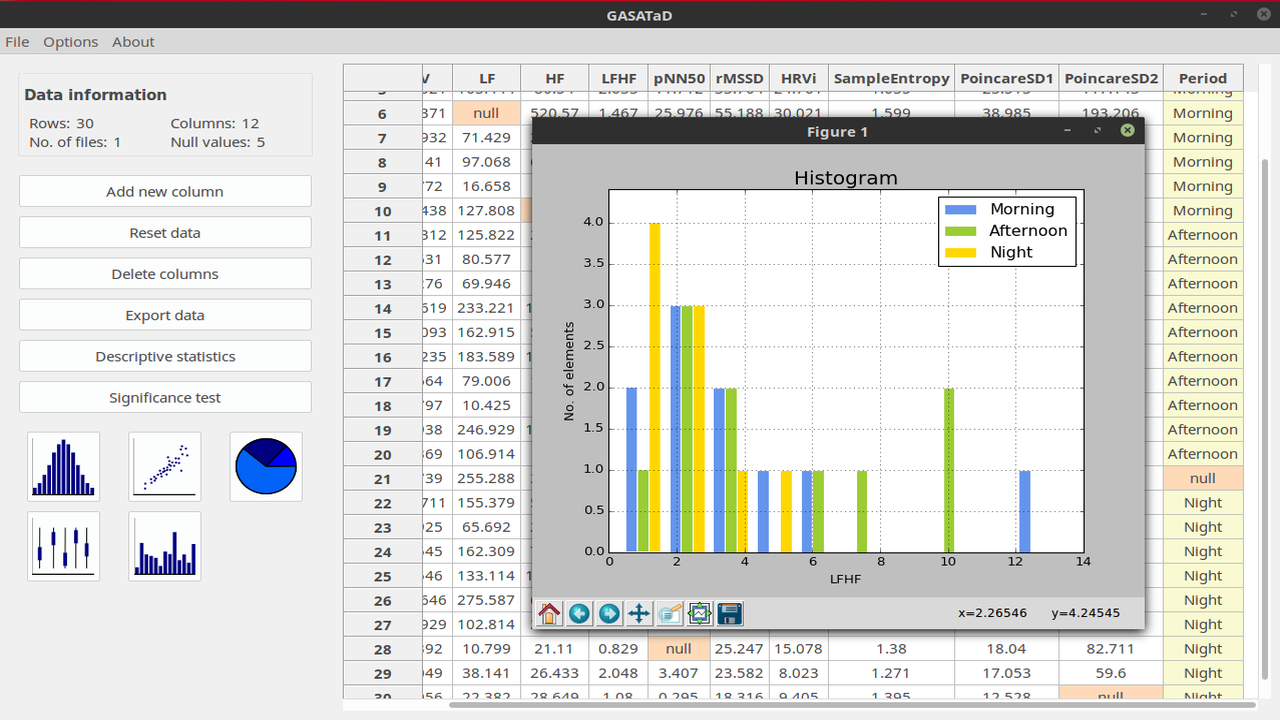
GASATaD reads .csv or .xls/.xlsx files and allows users to perform different statistical tests across columns of data. It generates high quality plots and it can export them to .pdf, .svg, .png, .tiff or .eps files.
Free to download and use for any purpose
Modify and improve it as you wish
Binaries are available for Microsoft Windows, debian-based GNU Linux platforms and Apple MacOS
It is based on mature python libraries, such as numpy, scipy, pandas or matplotlib
It generates high quality plots suitable to be included in technical reports or scientific papers
GASATaD is available for different platforms
Windows binary 32/64 bits (.msi) v2.0 MacOS v2.0 Debian package (.deb) v2.0 Source code (.zip) v2.0