gHRV
A graphical tool for Heart-Rate Variability analysis
This project is maintained by milegroup
What is gHRV?
gHRV is a new graphical tool to clinicians and researchers interested in Heart Rate Variability Analysis.
The objective of gHRV is to be powerful and easy to use and install.
gHRV is distributed as free software (GNU GPL License) and binary packages are available for Windows, MacOSX and GNU/Linux systems.
Feel completely free to use gHRV in your research. You can cite our work with this reference:
L. Rodríguez-Liñares, M.J. Lado, X.A. Vila, A.J. Méndez, P. Cuesta, "gHRV: Heart Rate Variability analysis made easy". Computer Methods and Programs in Biomedicine, Volume 116, Issue 1, August 2014, Pages 26-38.
DOI: 10.1016/j.cmpb.2014.04.007
Main features
Reads Polar, Suunto, ASCII (beats and RR series) and WFDB (qrs) beats files
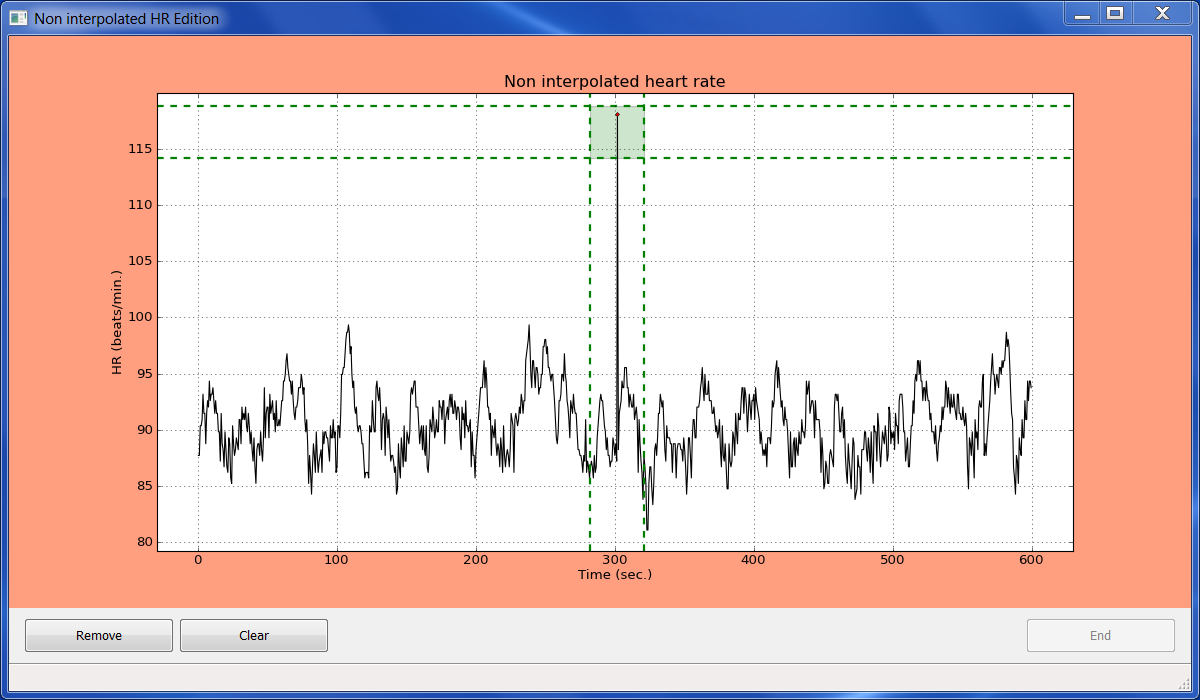
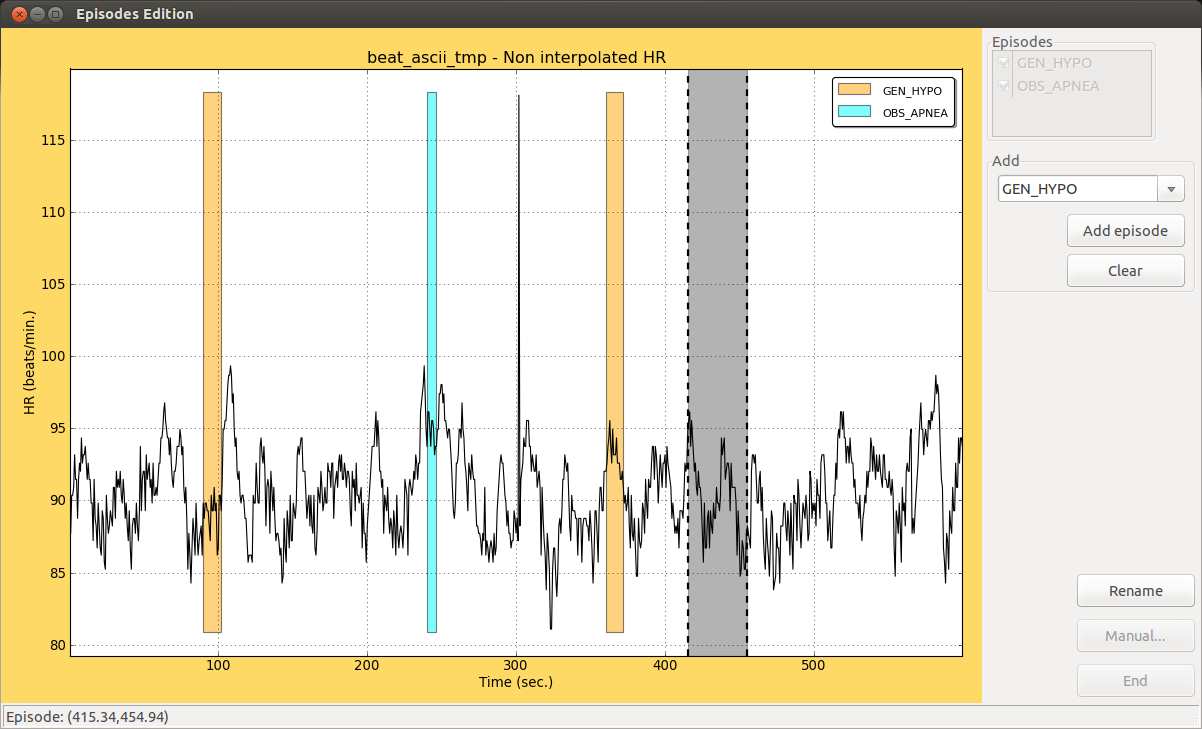
Episodes can be read from ASCII files, inserted, edited and deleted. gHRV includes both a graphical and a spreadsheet-like tools for editing episodes.
Time-domain, frequency-domain and non-linear analyses are included. Some of the included measures are:
• Time-domain: SDNN, SDANN, rMSSD, SDNN index, pNN50, HRV triangular index and TIN.
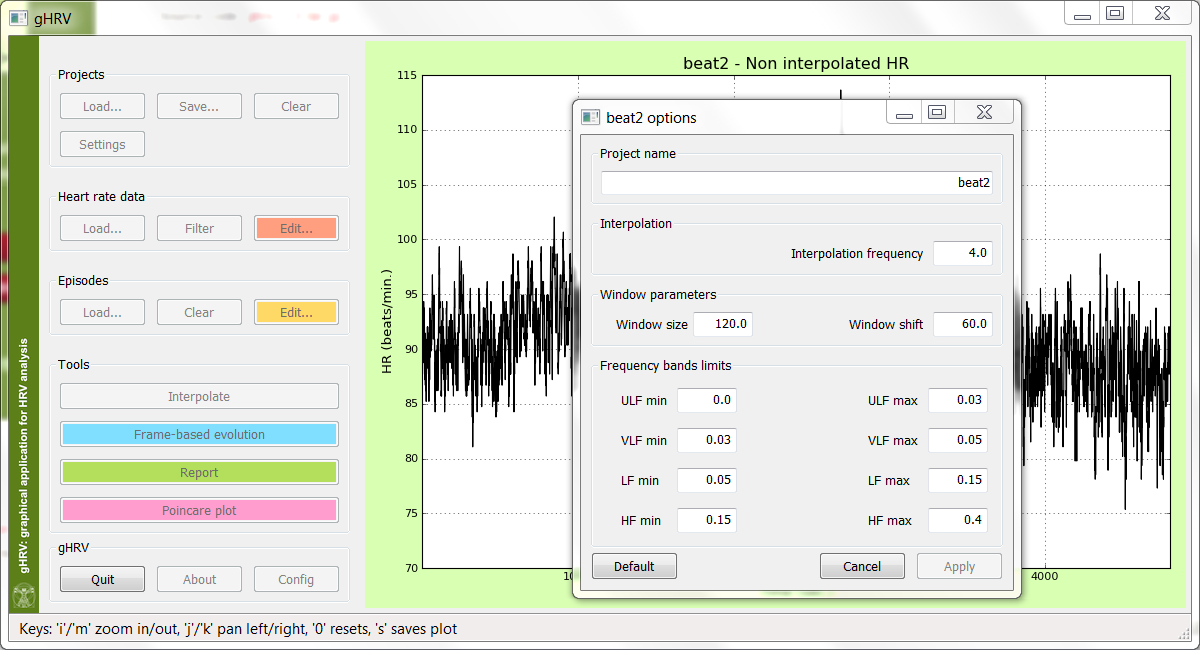
• Frequency-domain: power in ULF, VLF, LF and HF bands, total power and LF/HF ratio.
• Non-linear: approximate entropy, fractal dimension and SD1 and SD2 from Poincaré plots.
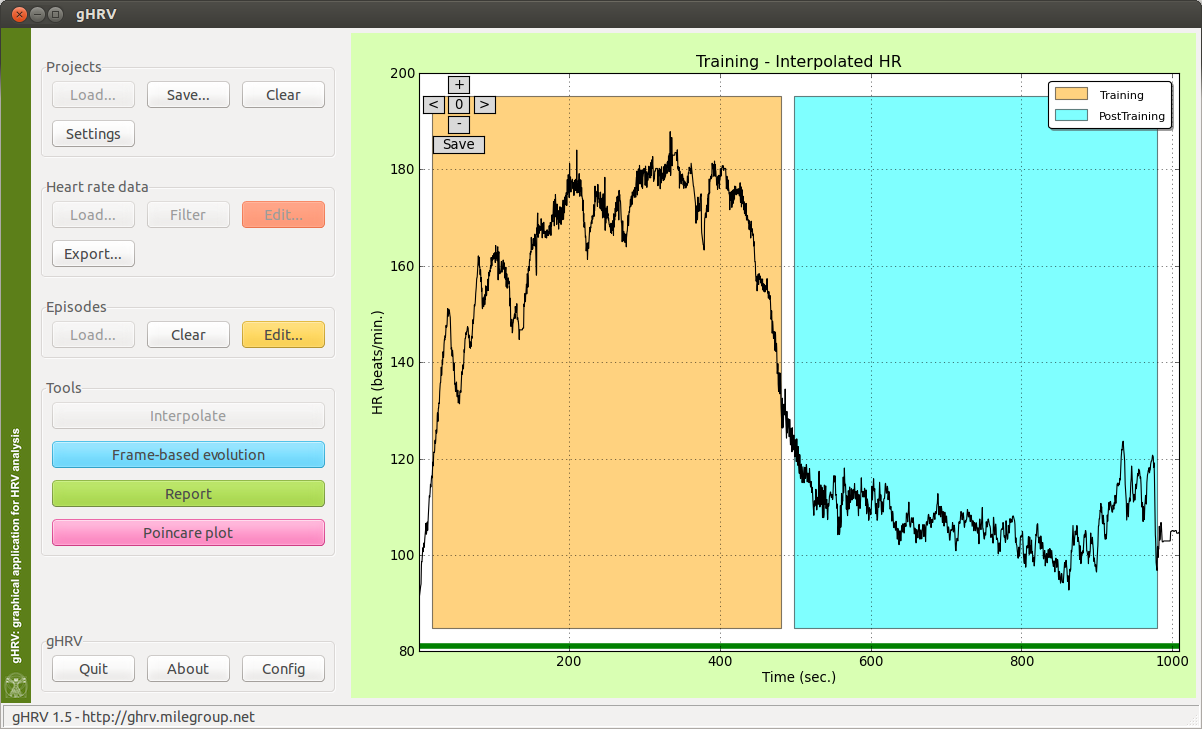
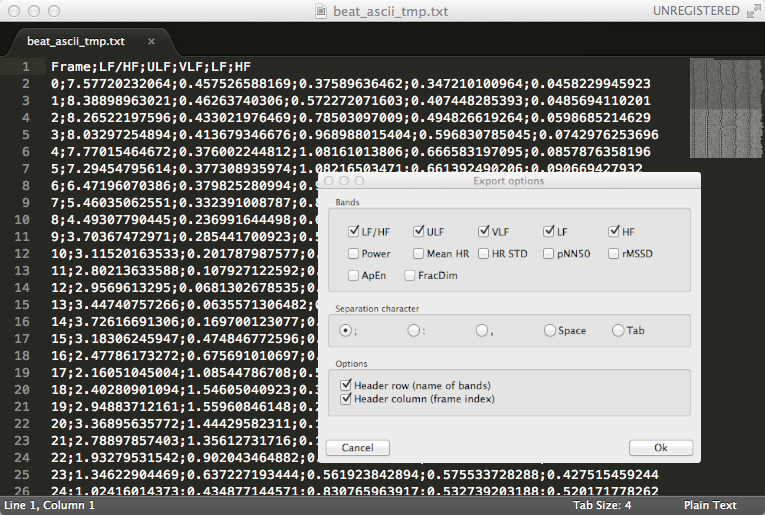
It generates high-quality plots that can be exported in eps, tiff, svg, png, pdf and jpg formats.
It shows reports that can be saved in html format.
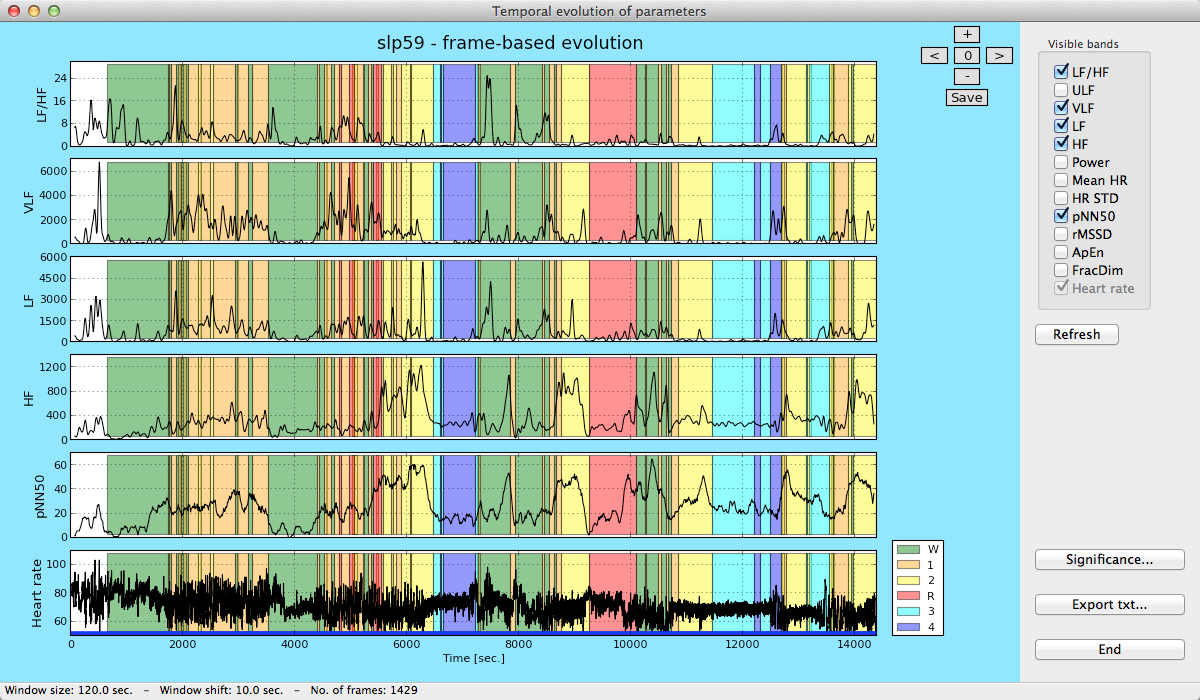
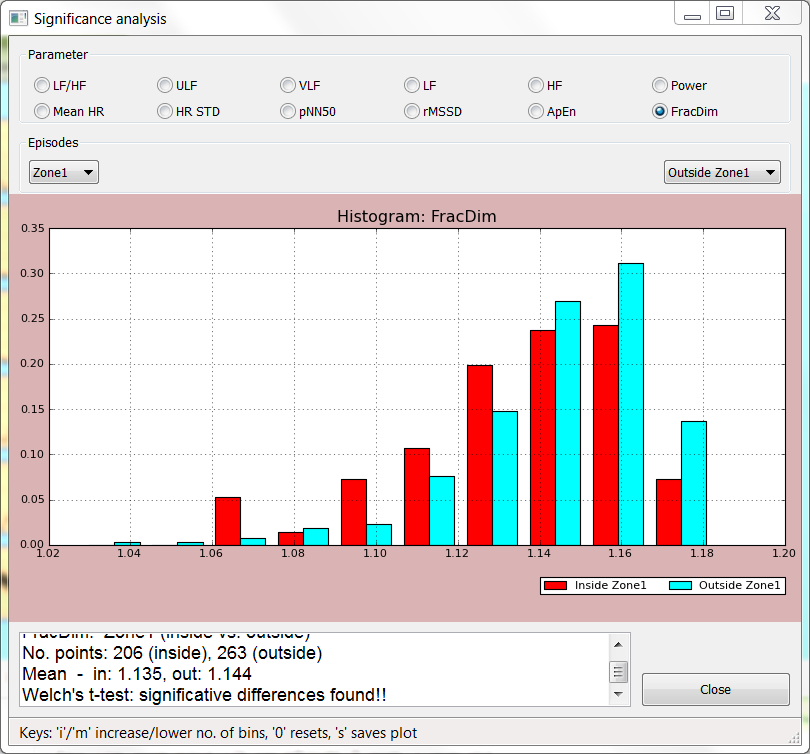
Temporal evolution of frequency-domain and non-linear parameters can be represented and significance tests of these paremeters in different areas can be performed.
Screenshots