Main features of GASATaD
GASATaD is a free, open source statistical program that offers the following functionalities:
Merges data of different nature from different files.
Calculates basic statistical results over the data.
Performs different significance test.
Classifies data into different categories.
Generates and exports high quality plots.
Hardware and software requirements
Basic hardware requirements to run GASATaD are 3GB of RAM, and 5GB free space of hard disk.
The application runs on GNU/Linux (e.g. Ubuntu Linux), Microsoft Windows and MacOS.
Interface description
The main window of the application allows users to access all the functionalities.
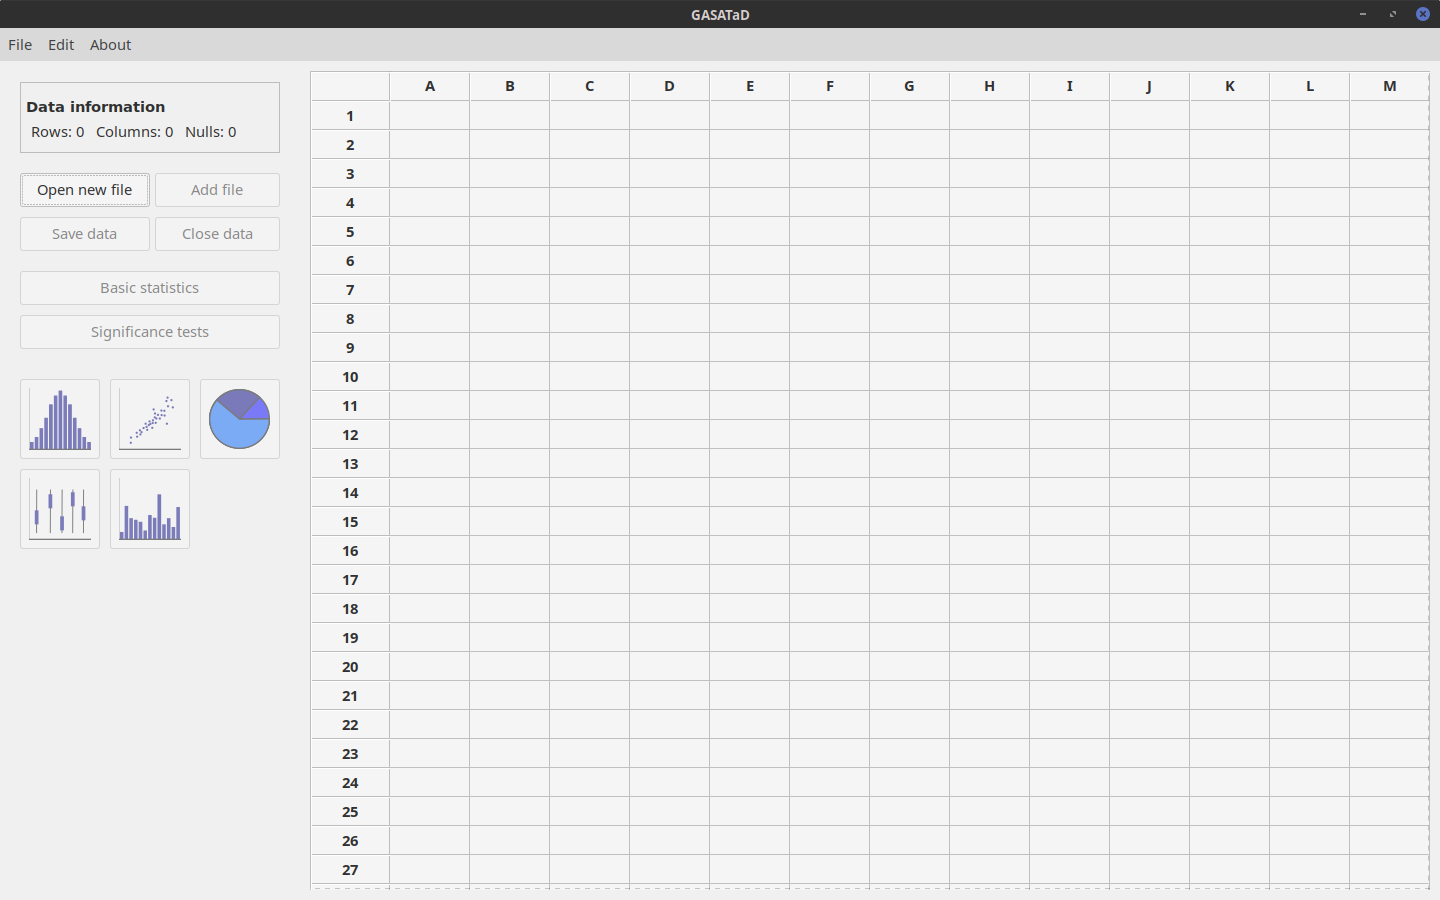
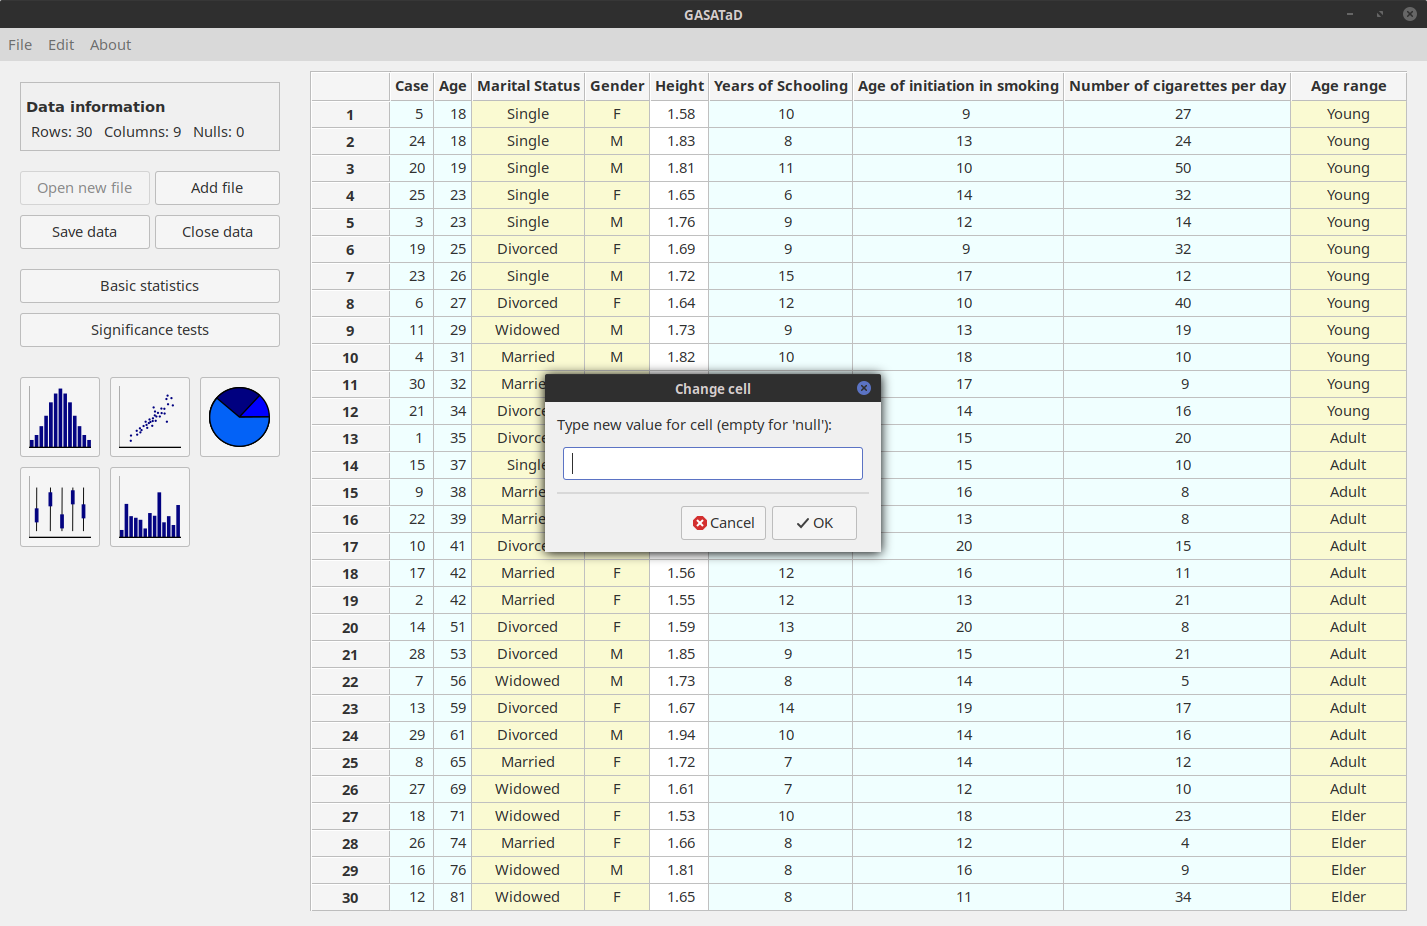
On the right side of the window, the data is displayed on a table after files have been opened. Initially, columns are labeled using letters and rows are labeled with numbers. Numerical values appear in white or light blue cells, depending if they belong to float or integer columns, respectively. Textual data is presented in yellow background.
On the left panel, the upper area shows information about the data (number of rows, columns and null values). Just under this area, buttons are available to manage data and files, or to perform basic statistical analyses or significance tests. Below, plotting functionalities are included.
A five minutes guided example in GASATaD
First, download .csv data files from https://milegroup.github.io/gasatad/#download. Uncompress to obtain two files: testfile1.csv and testfile2.csv.
-
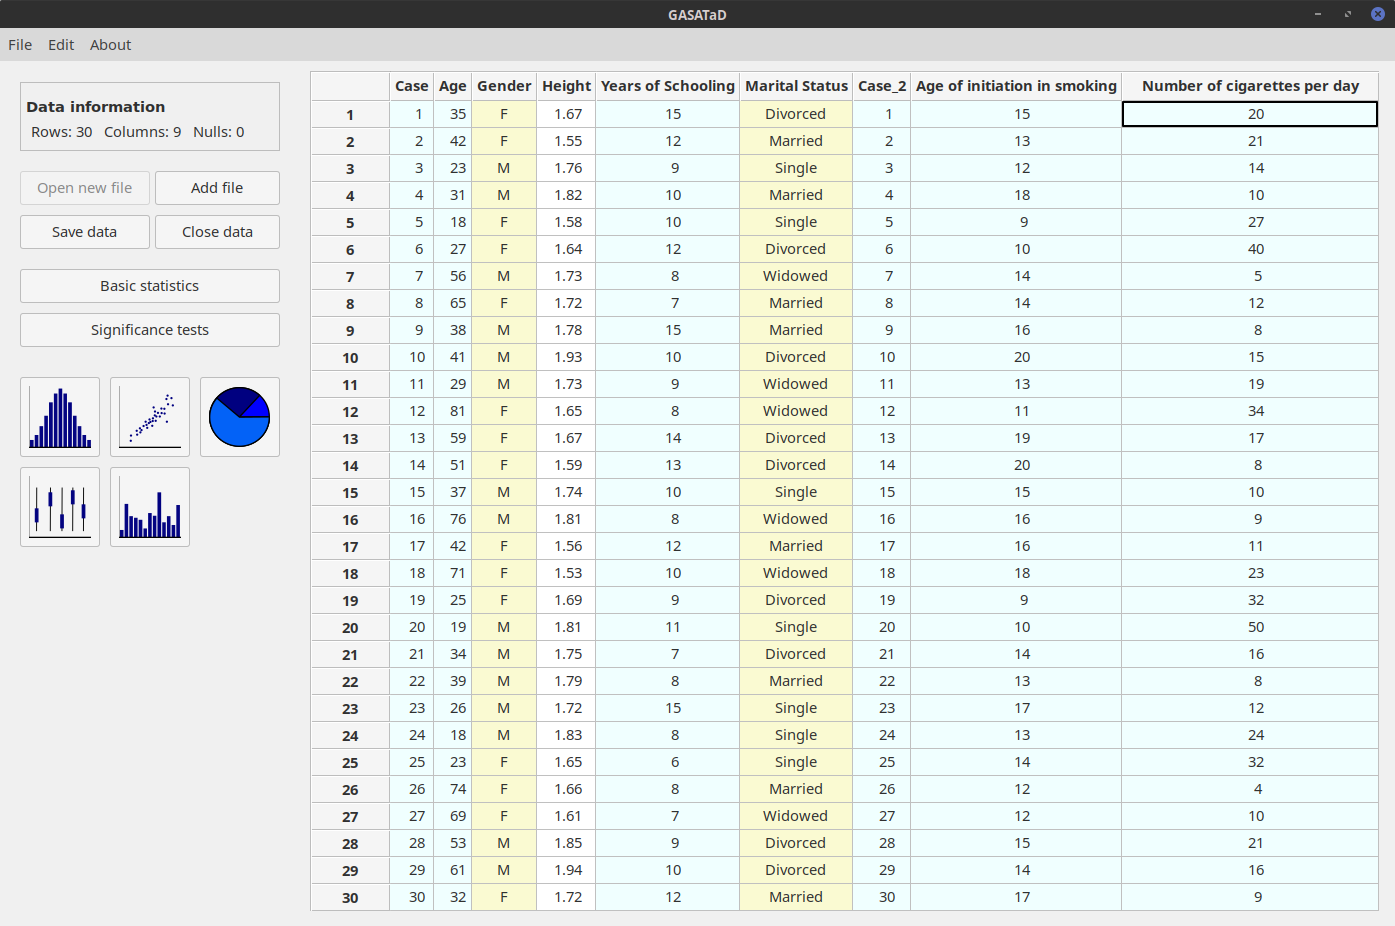
Load data:: open both files with GASATaD, using first Open new file and then Add file, on the left panel. The data will be shown as in the figure below.
-
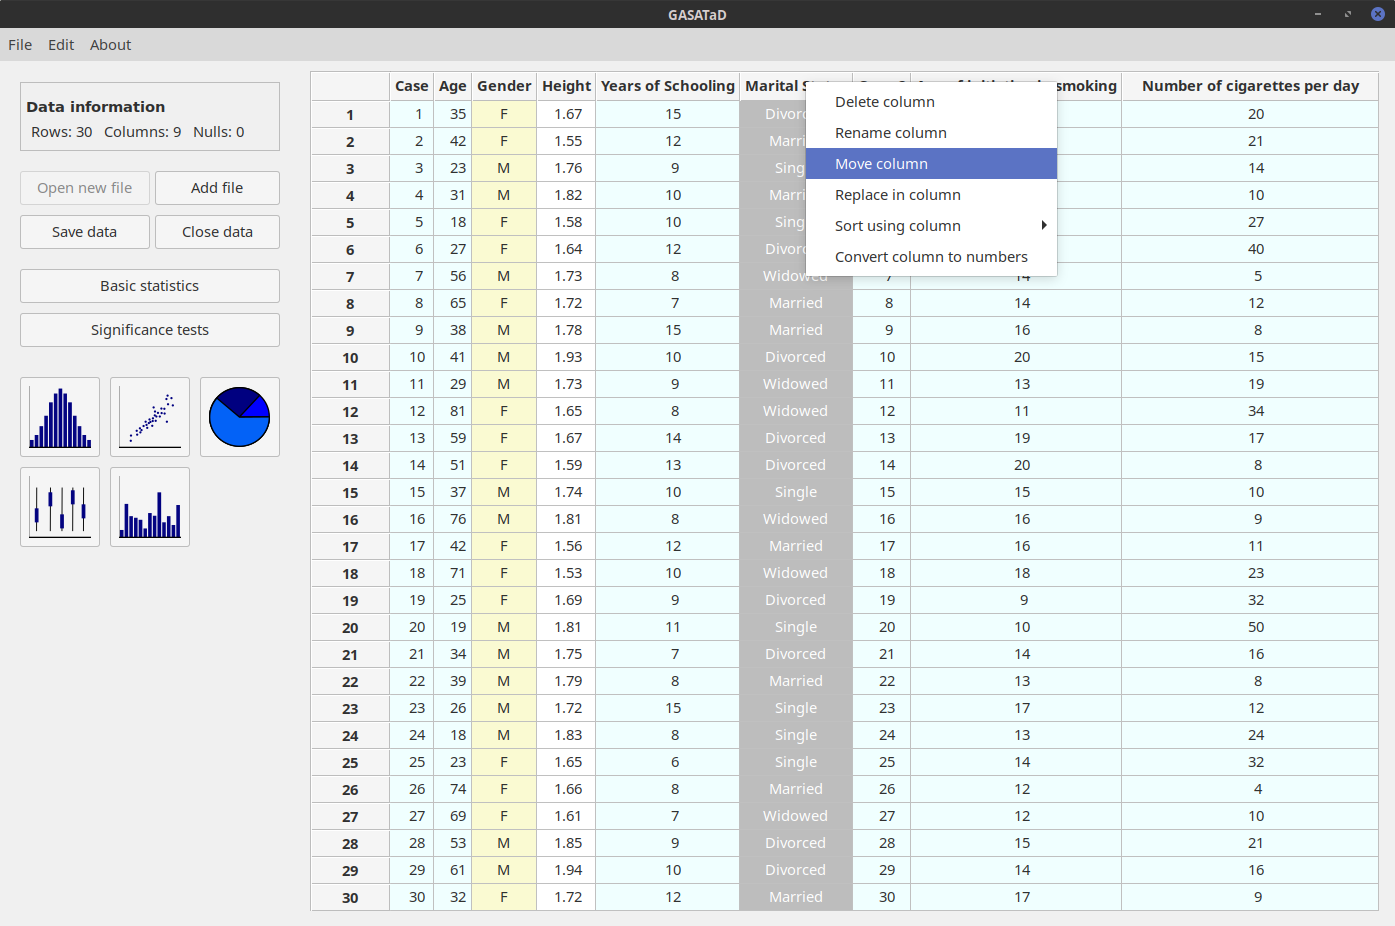
Move column: select the column Marital Status, press the right mouse button; click on Move column and enter the desired position (see below).
-
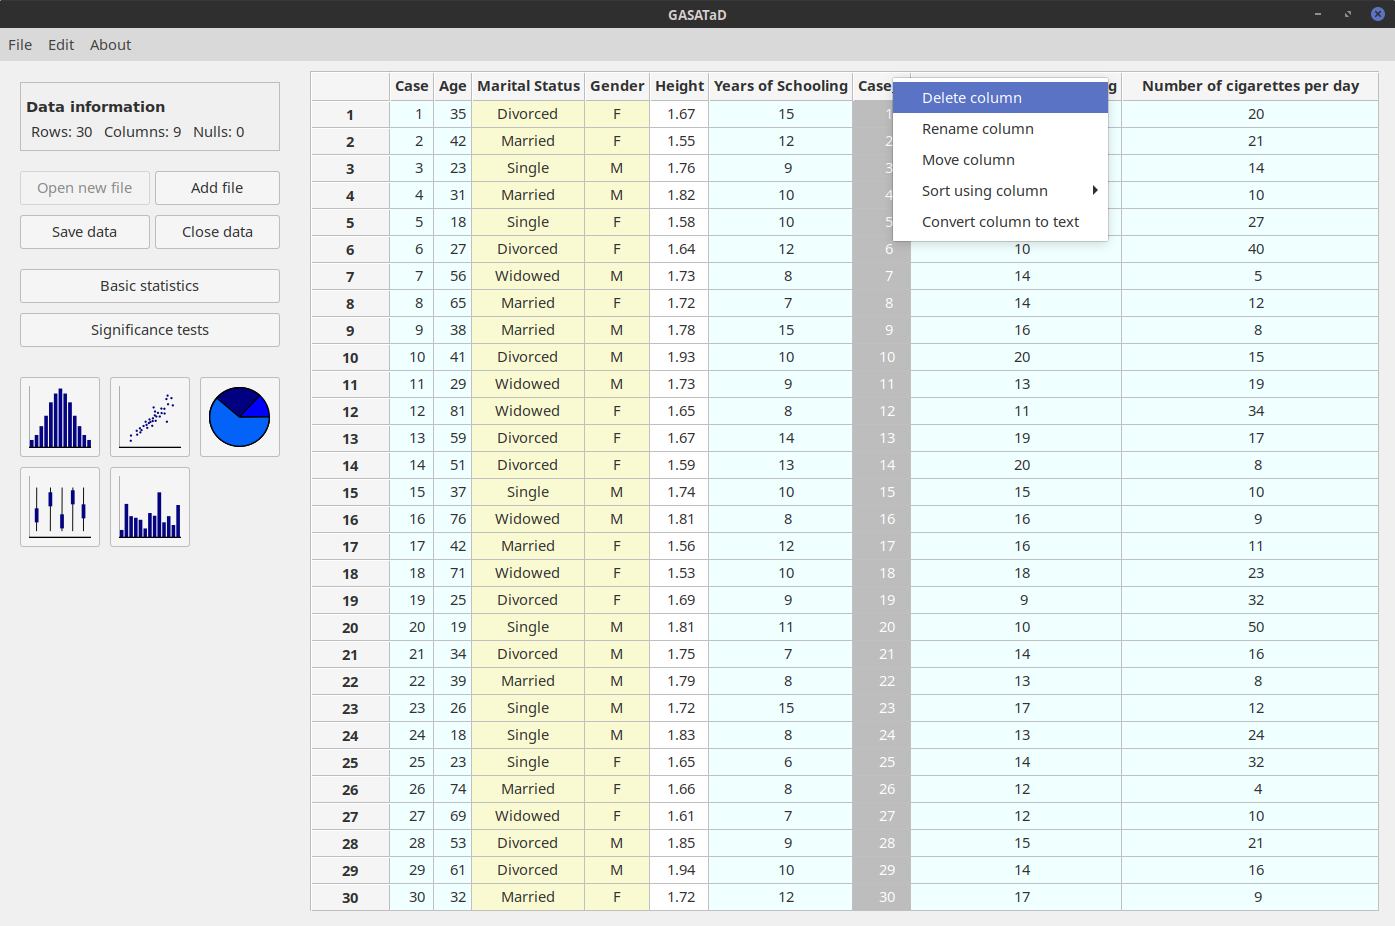
Delete a column: select the column Case_2, right-click and use the Delete column option. Rows can be deleted likewise.
-
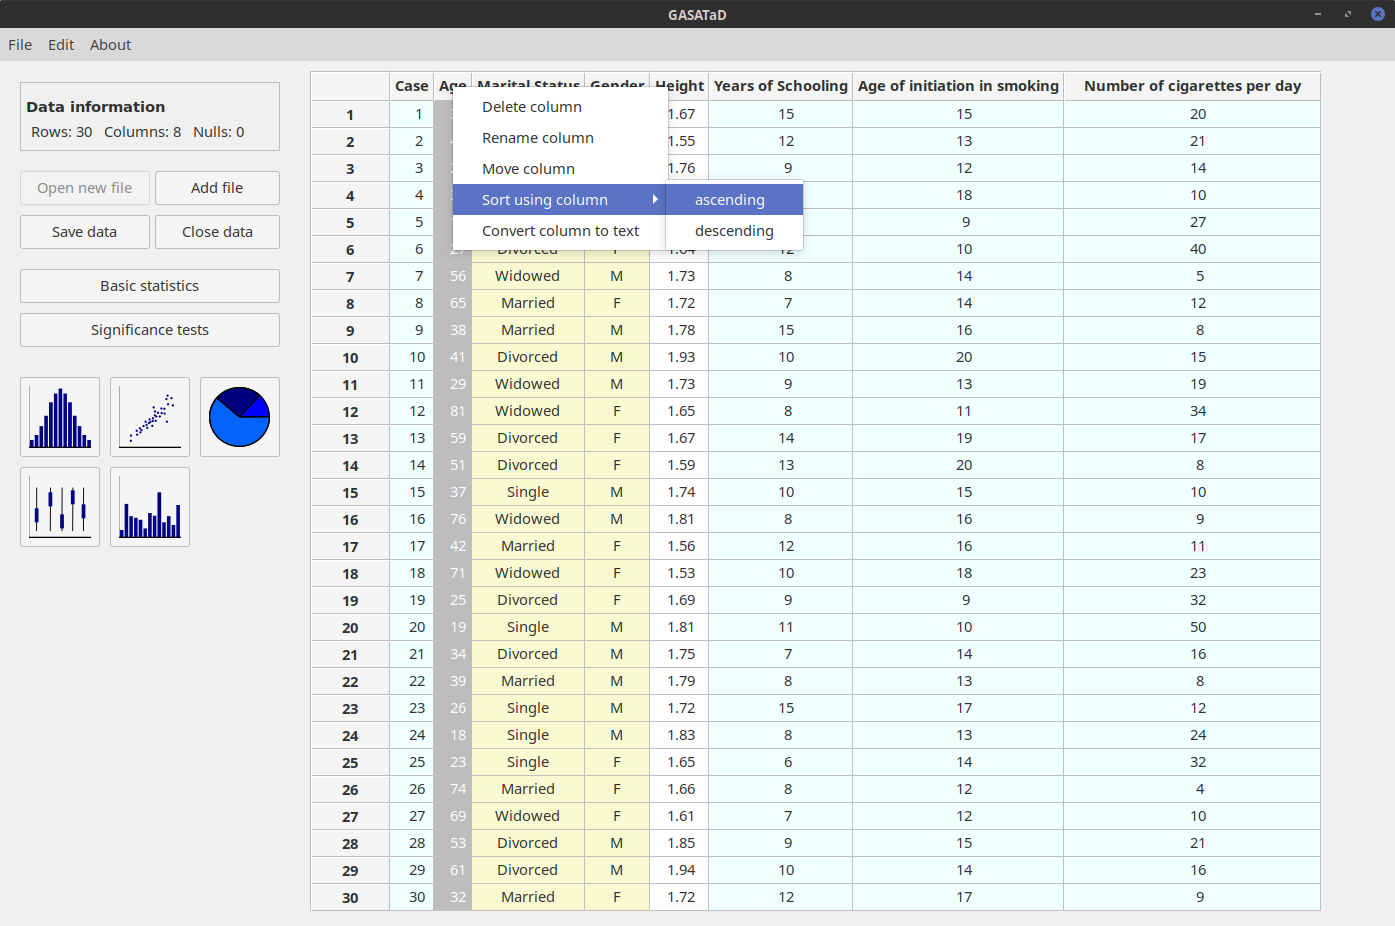
Reorder the rows of the table: select the Age column and then you can either use the main menu (Edit → Sort using selected column → ascending), or right-click and the Sort using column → ascending option.
-
Divide the data into new categories: on the main menu, use the Edit → Add text column option. On the new window that appears, complete the data as shown below.
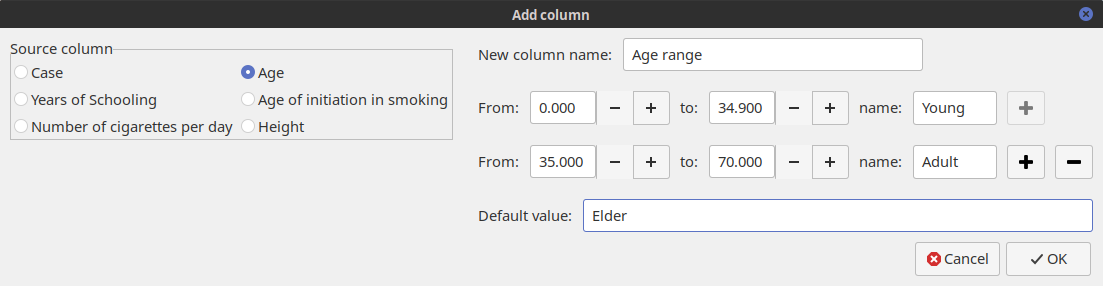
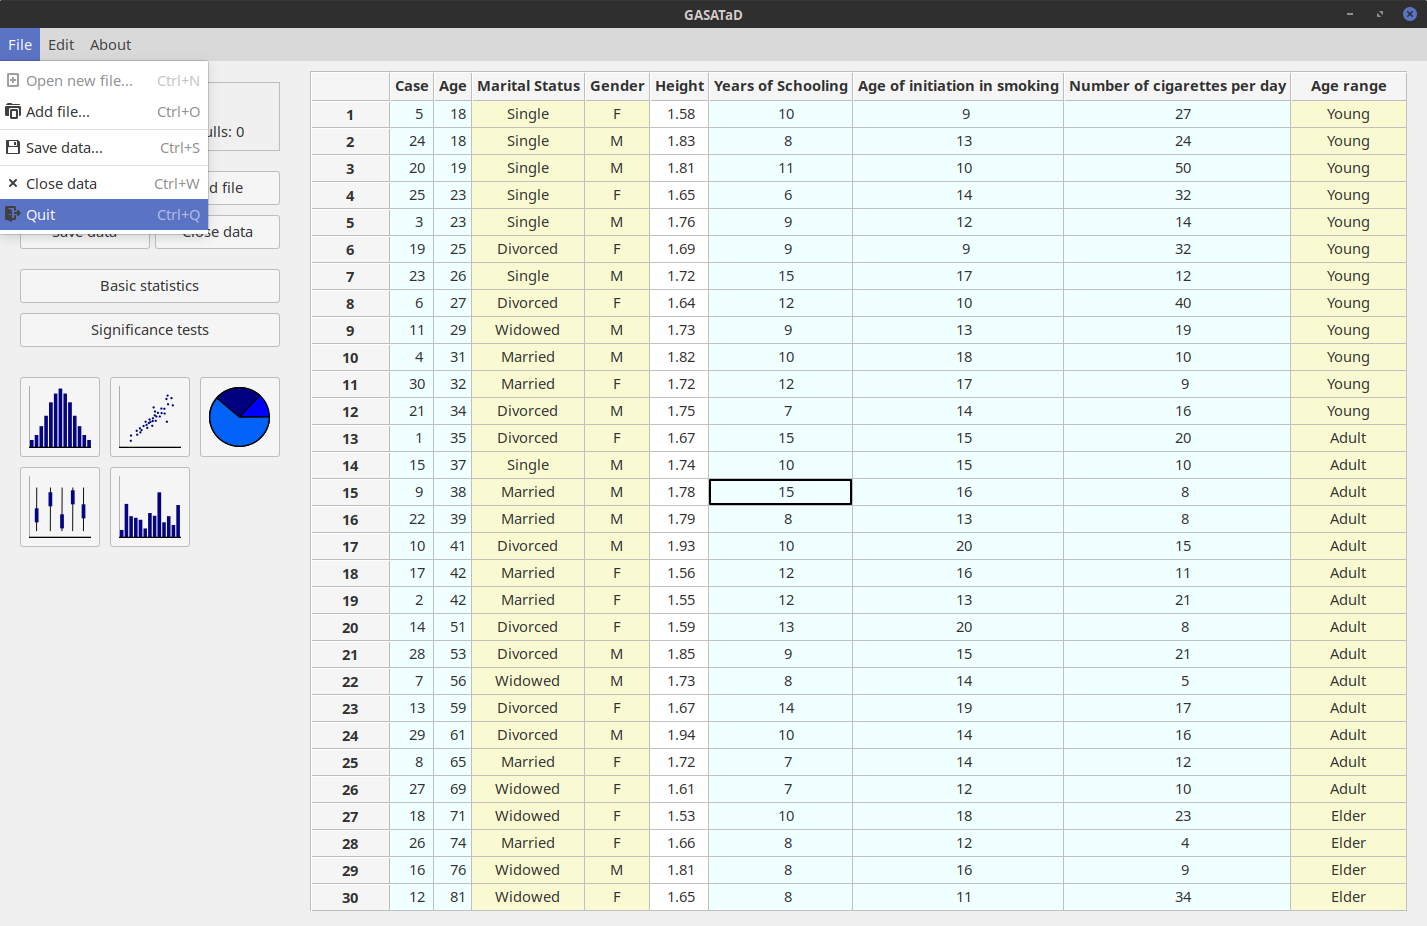
A new column labeled Age range will be created. This column classifies the rows into three different age ranges: young, adult and elder.
-
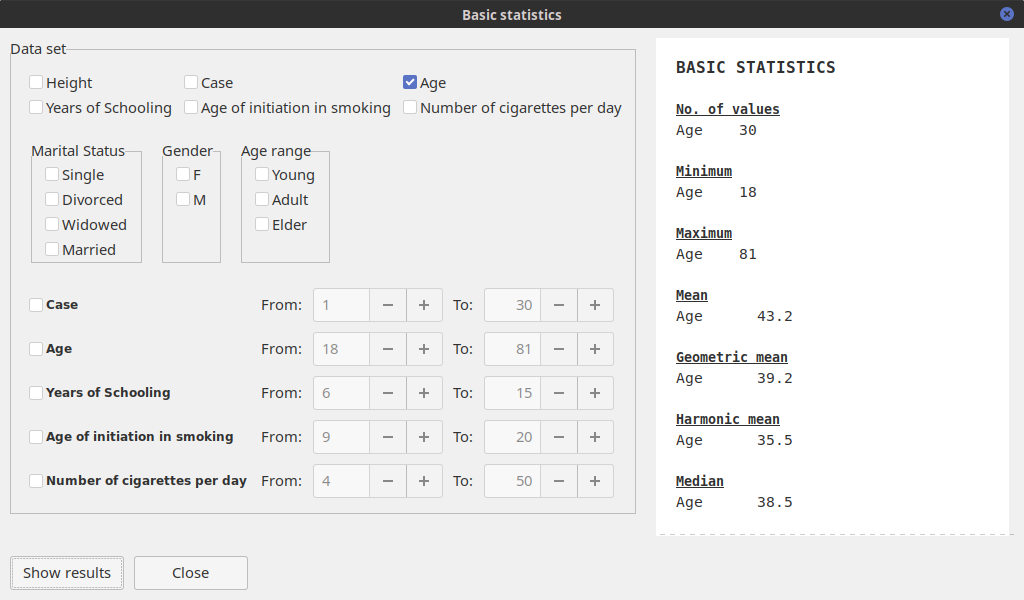
Calculate basic statistics of a numerical column: on the left panel, click on the button Basic statistics, and select the column Age. You can restrict which values of the column are going to be used, and, after pressing Show results, a basic statistical analysis of these values will be presented.
-
Perform a comparative analysis between variables: on the main window, click on the button Significance tests. Select two numerical columns to be used in the test. After pressing Show results values are presented for the following significance tests: Student's t-test, analysis of variance (ANOVA), Welch, Levene, Kolmogorov-Smirnov, Wilcoxon rank-sum and Kruskal-Wallis.
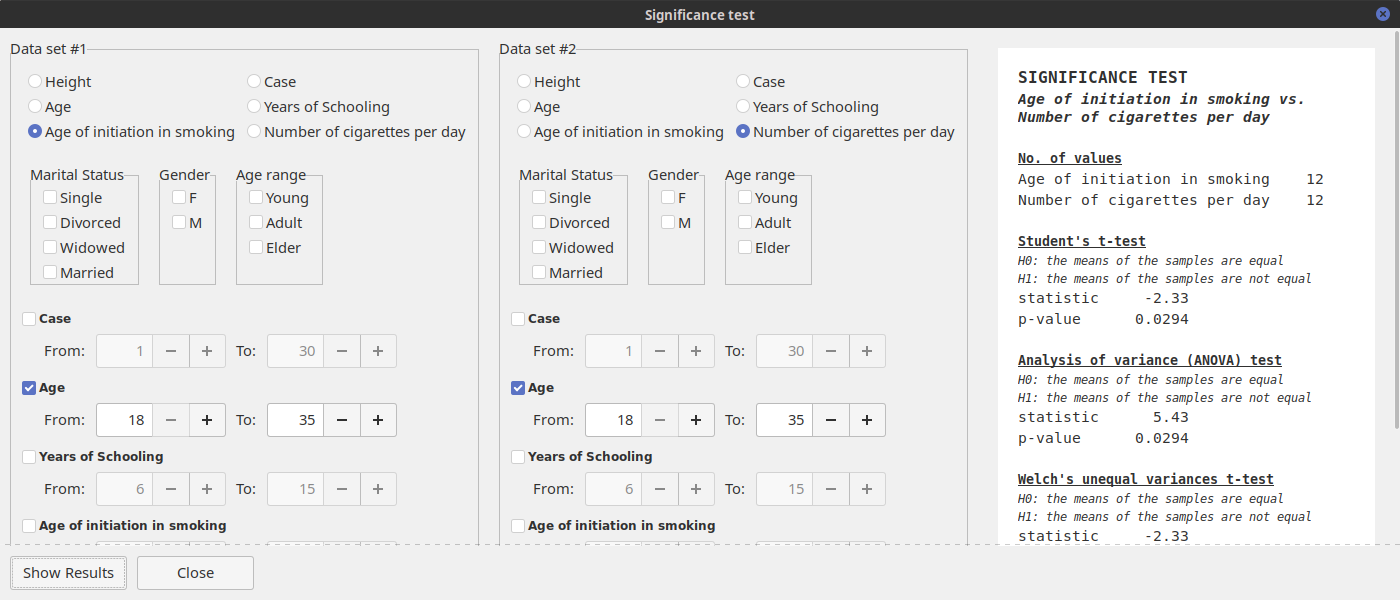
-
Plot data: on the main window, click on the button depicting a pie-chart. Select the tag Age range and, after pressing Ok, a new window containing the plot will open.
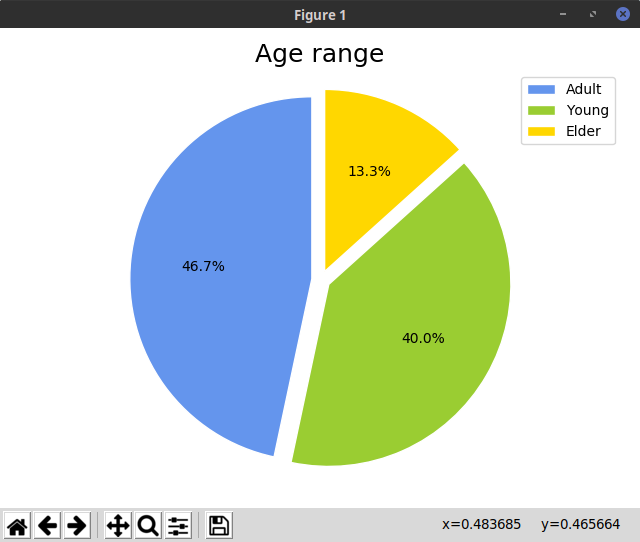
The plot can be modified by clicking on the buttons at the bottom of the image (the aspect of the buttons can be different depending on the operating system):
 moves the plot along the x and y axes.
 selects and zooms in areas of the plot.
 edits margins.
 allow users to un-do or re-do actions.
 resets the plot.
 saves the plot to file. Possible formats are .epg, .pgf, .pdf, .png, .ps, .raw, and .svg.
-
Edit data: individual cells can be modified by double-clicking on them:
-
Exit: to quit GASATaD, just use either use the File -> Quit menu option or close the window.